Research Article
Sounding procedure for characterization of big fusion reactor chambers by means of a compact neutron source with a nanosecond pulse duration

VA Gribkov1-3*, B Bienkowska1,2, S Jednorog1, M Paduch1 and K Tomaszewski4
1Institute of Plasma Physics and Laser Microfusion, Warsaw, Poland
2Interreginal Public Organization Moscow Physical Society, Moscow, Russia
3A.A. Baikov Institute of Metallurgy and Material Science, Moscow, Russia
4ACS Ltd., Warsaw, Poland
*Address for Correspondence: Vladimir Gribkov, Institute of Plasma Physics and Laser Microfusion, Warsaw, Poland, Tel: +7-499-135-9643; Email: gribkovv@rambler.ru
Dates: Submitted: 07 September 2018; Approved: 19 September 2018; Published: 20 September 2018
How to cite this article:Gribkov VA, Bienkowska B, Jednorog S, Paduch M, Tomaszewski K. Sounding procedure for characterization of big fusion reactor chambers by means of a compact neutron source with a nanosecond pulse duration. J Phys Res Appl. 2018; 1: 033-051. DOI: 10.29328/journal.ijpra.1001003
Copyright: © 2018 Gribkov VA, et al. This is an open access article distributed under the Creative Commons Attribution License, which permits unrestricted use, distribution, and reproduction in any medium, provided the original work is properly cited.
Keywords: Fusion reactors; Dense plasma focus; Nanosecond neutron pulses; Neutron activation diagnostics; Time-of flight spectral diagnostics
Abstract
In the paper a methodology that is elaborated for characterization of big-sized chambers of modern and future nuclear fusion reactors is described. It gives an opportunity to define distortions introduced by surroundings, systems and elements of the chamber into the neutron field generated during the reactors’ operation. The procedure is based on two types of experimental techniques supported by MCNP numerical modelling. These two classes are: 1) the neutron activation methods for measuring changes in anisotropy of the “absolute” neutron yields, and 2) the time-of-flight process for determination of neutron spectra deformations. MCNP calculations afterwards give an opportunity to fix just those elements of the surroundings that introduce the main impact in the perturbed neutron field characteristics.
Introduction
Modern and future chambers of nuclear fusion reactors are rather complicated constructions installed in an intricate environment. Elements of the surroundings represent absorbers and scatterers for the main fusion energy carriers – neutrons [1].
Neutron fields that are irradiated from the chambers of the modern main-stream fusion facilities with magnetic and inertial plasma confinement like Joint European Torus (JET) [2], Wendelstein 7X Stellarator (W7X) [3] (and in future the International Thermonuclear Experimental Reactor (ITER) [4]), or like the National Ignition Facility (NIF) [5] and Z-Machine [6], (Jupiter in future [7]) are distorted by their environment. In fact the architecture of the buildings as well as numerous elements of the Nuclear Fusion Chambers’ (NFC) constructions and intrinsic equipment (magnet systems, laser beam and current guides, divertors, plasma heating devices, diagnostic complex, etc.) represent neutron scatterers and absorbers. So they can produce in neutron intensity around the fusion chambers “voids” and “hot spots” and change neutron spectra due to elastic and inelastic neutron scattering even at an absolutely isotropic initial expansion of neutrons into space from a source with symmetric their spectra (e.g. from a hohlraum in NIF or from an element of the toroidal plasma thread in JET). Note here that these two techniques will be also important from the point of view of the radiation material resistance: they will give an information where one may expect increased or diminished values of dpa in the first-wall and construction materials of a NFC.
However it is possible to characterize a 3-D neutron field formed around a nuclear fusion chamber beforehand with a help of an extraneous powerful point neutron source that has pulse duration in a nanosecond (ns) range. The intense short neutron flash will allow attributing and describing all absorbers and scatterers inherent to a NFC by using measurements of neutron fluxes (with neutron counters) and spectra (with photomultiplier tube plus plastic scintillator – PMT+S) in all directions.
A very intense ns neutron pulse irradiated from a tiny volume can be generated by a nuclear fusion device named Dense Plasma Focus (DPF) [8]. Moreover the neutron emission of it is quasi-mono-energetic one (ΔEn/E0 ≈ 3-5%, where ΔEn – full width of neutron energy distribution at its half maximum (FWHM), E0 – a value of the maximum of neutron energy distribution). So it gives an opportunity to distinguish between elastic scatterings produced by different parts of a chamber or by different chemical elements of their content and to use time-of-flight technique for spectra measurements with a moderate path length.
Nuclear fusion reactions in a DPF are produced by a beam-target mechanism, i.e. at the interaction of magnetized fast deuterons with pinched plasma [8]. Accelerated fast deuterons have spectrum that peaked at about a hundred keV. The device may work with pure D or D-T mixture as working gas producing neutrons with mean energy at around 2.5- or 14-MeV energy peaks correspondingly as it is so in the main-stream NFCs. At this ns-pulse case the activation time of a majority of materials used in activation technique will be much shorter compared with their decay half-life.
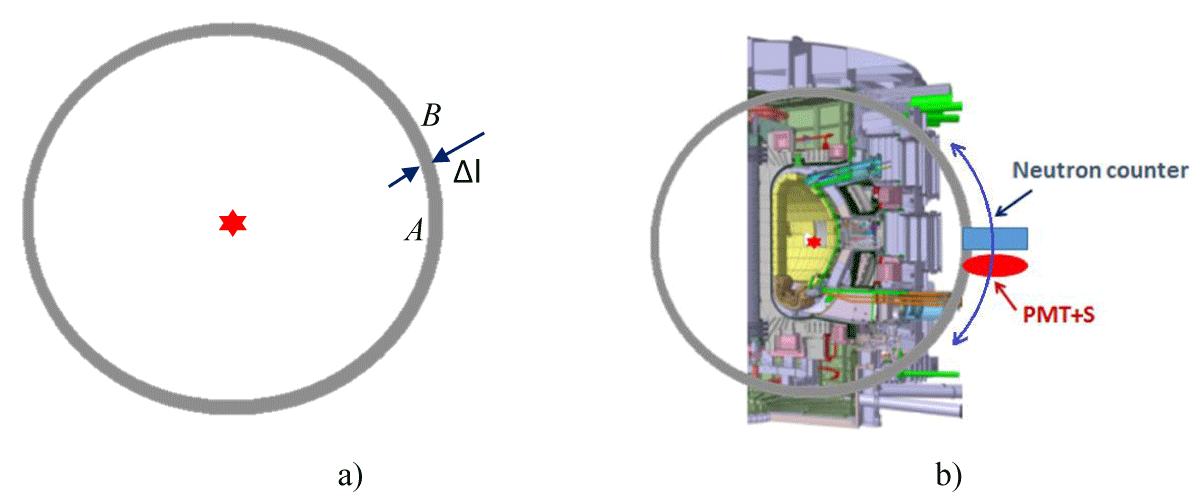
Nanosecond neutron pulses are irradiated from the DPF chamber into space as a neutron “shell” (Figure 1a) having almost a spherical shape. The space between the surfaces A and B of the sheath filled with neutrons has a thickness Δl equal to pulse duration of neutron radiation Δt multiplied by neutron speed v:
Δl = Δt × v (1)
This quasi-spherical shell will be distorted during its propagation from the compact source outwards by elements and systems belonging to a NFC because of neutrons scattering and absorption. So such a source can be able to describe an influence of each element of a NFC produced during an expansion of the neutron field through the chamber outside in all directions (Figure 1b).
Figure 1: A spherical neutron “shell” (a) irradiated from a compact neutron source (shown by a star) of a ns pulse duration having a thickness in space Δl (1) and its possible use (b) in a large main-stream NFC (a sketch of a cross-section of ITER here).
This influence will be reflected in the absolute neutron flux measured in a certain spatial point in exterior of the chamber, as well as in a neutron pulse shape and, consequently, in spectrum of neutrons passing throughout a large NFC (time-of flight – TOF – technique). Moreover, the spatial thickness of the neutron “shell” irradiated from the above-mentioned DPF-based point ns source will have a value of about tens of cm being much less compared with the main construction elements of a NFC of a main-stream fusion facility (e.g. magnets, divertors, etc.). So to characterize objects by such a bright short-pulse neutron radiation one may use elastic and inelastic scattering of neutrons produced in D-D or D-T nuclear fusion reactions by DPFs upon nuclei of unknown elements. Note that this short powerful neutron flash will allow using TOF technique with flight bases of the order of real sizes of modern NFCs.
In principle, these measurements can be carried out by positioning of a DPF in the center of the spherical chamber of NIF or at the movement of a compact DPF-based neutron source along the circumference of the toroidal chamber of a modern fusion device (e.g. ITER). The procedures of such a kind should be repeated after each important stage of assembling of a new main-stream fusion facility.
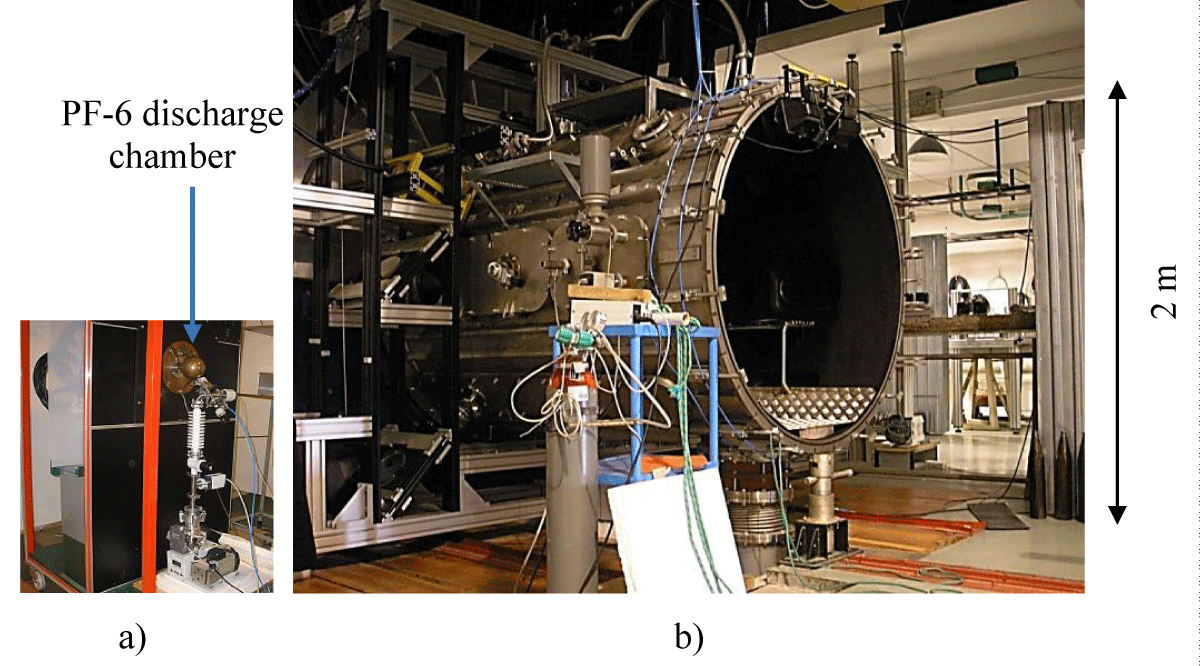
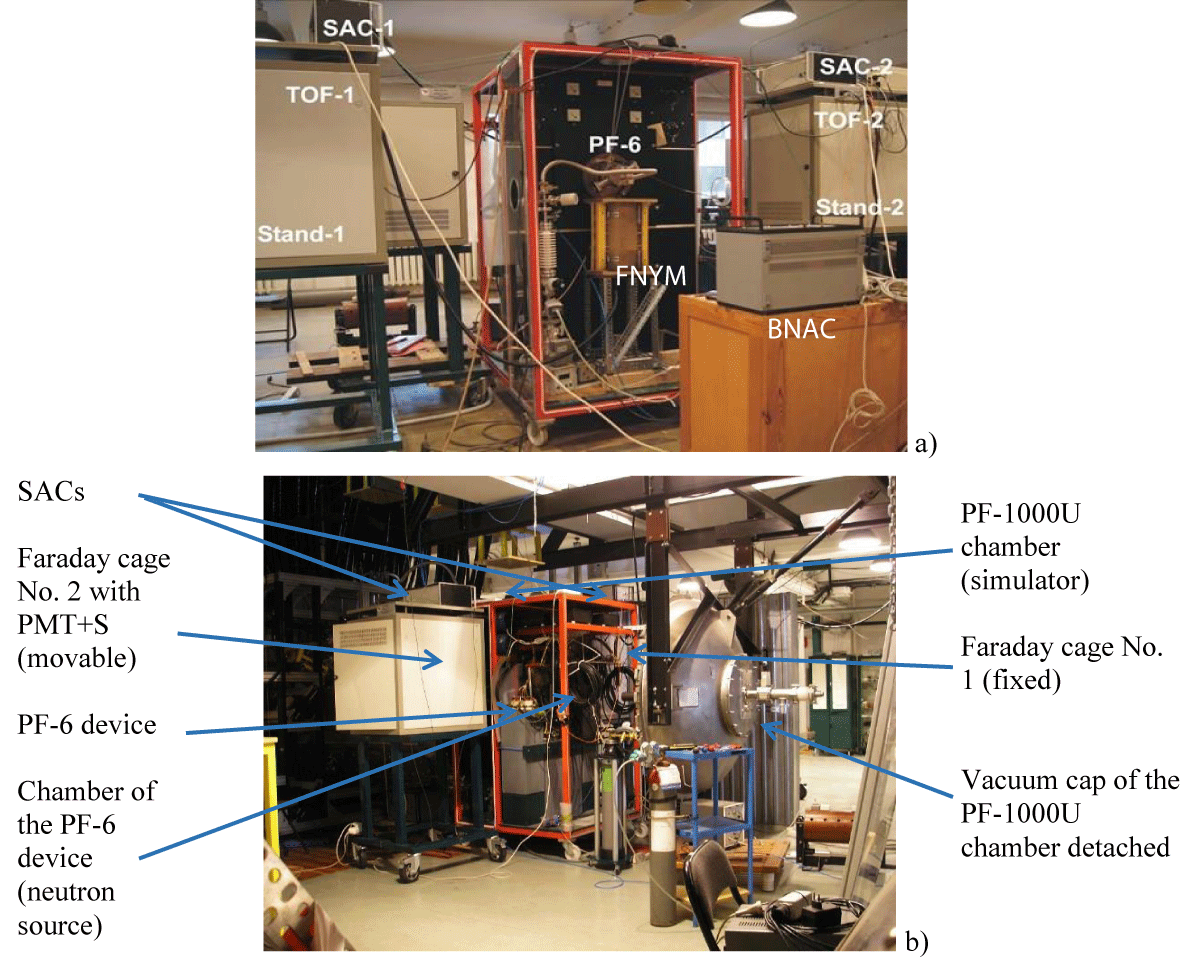
In the beginning we shall describe in this paper activation methodology based on neutrons generated in a DPF device PF-6 (Figure 2a) due to D-D reactions (so 2.45-MeV neutrons in these experiments are generated, and subsequently they are subjected mainly to elastic scattering on elements and systems of a NFC). We shall make it here in short because some features of this method is already presented in our recent paper [1]. Then we shall discuss more precisely a neutron spectroscopic technique here that we intend to use in the following experimental sessions. In our case (as it was in the experiments [1]) we shall exploit in the capacity of the simulator of a big NFC a large chamber of the PF-1000U facility [9] available at the Institute of Plasma Physics and Laser Microfusion (Figure 2b), Poland. The vacuum chamber of the PF-1000U device has the shape of a large cylinder with walls made of stainless steel. The DPF-1000U device is equipped with a large condenser battery (positioned one level up and one level down to the chamber’s floor) with the capacity of 1332 mF. The discharge circuit of the chamber consists of a set of cables and spark-gaps, which connect the capacitor battery with cylindrical concentric electrodes playing the role of a plasma accelerator. The device is sometimes called a plasma gun.
In our simulation experiments (and in MCNP calculations as well) we put the device PF-6 (Figure 2a) in front of the open chamber of the PF-1000U in a manner when the discharge volume of the PF-6 (so a neutron source) is positioned on the axis of the PF-1000U facility at its entrance (Figure 2b).
We shall also present here our simplified MCNP modelling procedure of the irradiation scheme used for precise identification of elements and objects that are distorting the neutron field (intensities and spectra) observed outside the simulator of a large-scale NFC.
Equipment based on PF-6 device as a compact ns-pulsed neutron source
PF-6 device: This machine (Figure 2a) is described in several papers (see e.g. [1, 10-12]). Its capacitor bank charged up to 20 kV contains about 6 kJ of energy. The definition of the device as a neutron source (its major parameters that were measured many times [1] including present experiments) is as follows:
Figure 2: Dense Plasma Focus device PF-6 (a) and a big chamber of the PF-1000U facility, simulating a section of a main-stream fusion chamber of a present-day tokamak.
− Neutron emitting plasma volume is less than 1 cm3
− Its neutron yield with deuterium used as working gas is about 109 neutrons per pulse
− Neutron pulse duration is about 20 ns
− Spectra of neutrons are different in dissimilar directions and are close to the energy 2.45 MeV with ΔEn/E0 ≈ 3-5%, where ΔEn – full width of neutron energy distribution at its half maximum (FWHM), E0 – a value of the maximum of neutron energy distribution in a particular direction.
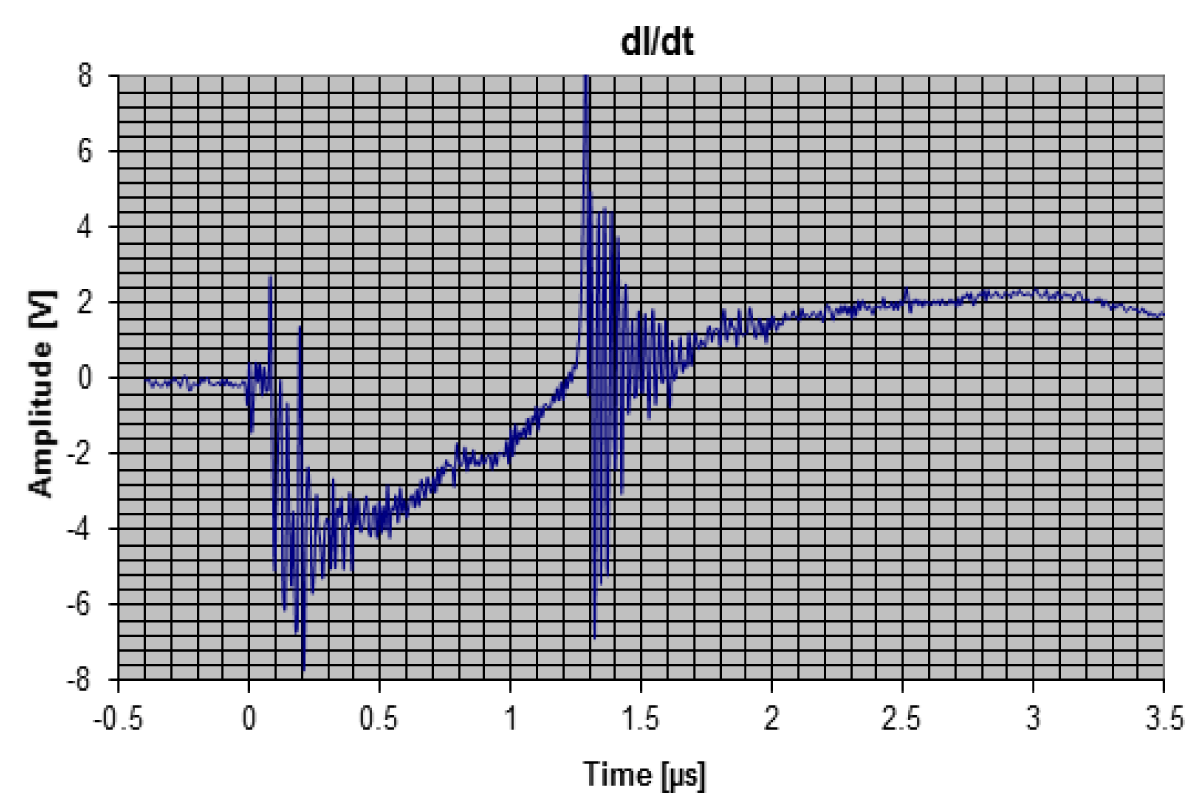
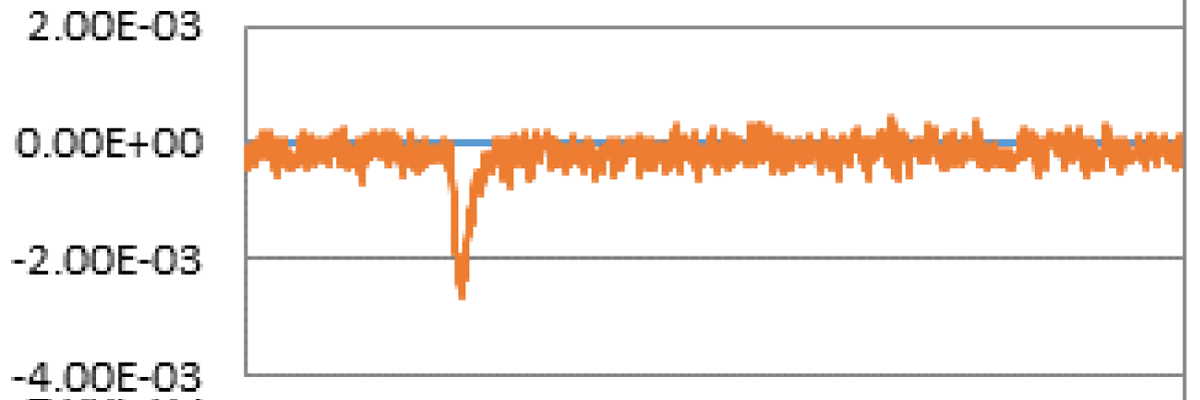
In Figure 3 the oscilloscope trace of the current derivative of a typical “shot” (discharge) of the device is presented.
Figure 3: Oscilloscope trace of the current derivative of a typical “shot” (discharge) of the PF-6 device.
Activation equipment: Our main activation detector (a silver activation counter – SAC) [1] (in fact two of them – SAC-1 and SAC-2) is based on silver as activated material. It is used as an effective way of neutrons measurement, especially when they are emitted in the form of short pulses like as it happens from the plasma produced in Dense Plasma Focus devices. SAC is composed of a Geiger-Muller (G-M) counter wrapped with a silver foil and placed within a hydrogen-reach moderator. Neutrons emitted from a pulsed source are slowed down in the moderator and induce two radiative capture nuclear reactions in the foil, which is made of natural silver:
n+107Ag→108Ag(T1/2 = 2.382min)→118Cd + β- (624keV) + υ-e
n+109Ag→110Ag(T1/2 = 24.5 s)→110Cd + β- (1185keV) + υ -e
(2)
Moderators are used in this method because cross-section of the above reactions is much higher for thermal neutrons rather for the fast ones. Indirect products of both reactions are β- emitters. The beta particles that are the results of silver activation reach the G-M counter and finally produce the electrical impulses, which are proportional to the number of neutrons coming from the source Yn. The average beta particle energies are presented in the brackets after the symbol of beta particle in (2).
We used these detectors with and without cadmium foil enveloping our moderators of SACs. This type of a screen is a very effective shield preventing penetration to the moderator and the counter of low-energy neutrons that appears due to multiple scattering in the environment. With this foil the effective “threshold” of neutrons’ energy registered by the counter is about 500 keV.
SACs that has been used since many years as the Yn monitor for the PF-6 device was calibrated many times by special isotope-based neutron sources placed inside the device’s chamber (e.g. with the AmBe source that is a mix of Am-241 and Be-9; yield: 2.0 to 2.4 x 10⁶ neutrons/sec. per Ci and 5.4 to 6.5x10⁴ neutrons/sec per GBq; half-life: 432.2 years; average neutron energy: 4.2 MeV (11 max); neutron dose rate: 2.2-2.7 mrem/hr at 1 m/Ci or 0.59-0.73 µSv/hr at 1 m/GBq). The next neutron source calibration (NSC) of SACs has been combined with MCNP calculation [13]. The SAC method has many limitations, so it is operated only until the full implementation of other methods of Yn monitoring.
Thus other elements [13] (indium, beryllium and yttrium) are introduced to use them in suitable activation neutron detectors for comparison (cross-calibration) with SACs. In a Table 1 one may see the basic nuclear data regarding the nuclear reactions that are engaged in the PF-6 neutron activation monitors where T1/2 – half-life time of particular radionuclides.
| Table 1: Basic nuclear data regarding the nuclear reactions that are engaged in neutron activation techniques. | |||||
| Target | Reaction | Product | T1/2 [a] | Mean Eβ [keV] | Intensity [%] |
| 107Ag | n,γ | 108Ag | 2.382 m | 629 | 95.5 % |
| 109Ag | n,γ | 110Ag | 24.56 s | 1199.36 | 95.18 % |
| 9Be | n,a | 6He | 806.7 ms | 1567.62 | 100 % |
| Eγ [keV] | Intensity [%] | ||||
| 115In | n,n' | 115m In | 4.486 h | 336.241 | 45.8 |
| 115In | n,γ | 116In | 54.29 m | 1293.56 | 84.8 |
| 1097.28 | 58.5 | ||||
| 416.90 | 27.2 | ||||
| 2112.29 | 15.09 | ||||
| 89Y | n,n' | 89m Y | 15.663 s | 908.960 | 99.16 |
| http://www.nndc.bnl.gov/nudat2/dec_searchi.jsp | |||||
The beryllium 9Be neutron activation counter (BNAC) is a good example of contemporary Yn monitoring method. It is convenient in particular if a DPF operates with a high repetition rate. It is so because of its short half-life time. The following reaction is taken into account:
9Be (n, α) 6He → 6Li + β– (3)
The cross-section for that reaction has an effective threshold near 1 MeV, which means that undesirable multiple-scattered neutrons do not undergo that reaction and, therefore, are not measured. The reaction cross-section for 2.45 MeV neutrons is about 80 mbarn and is sufficient for that purpose. The product of the reaction, 6He, decays with half-life T1/2 = 0.807 s emitting β– particles with mean energy of 1.568 MeV and maximum energy of 3.508 MeV [14].
Large area gas sealed proportional detector SP-126C (Canberra made) has been chosen as β–particles counter. The active area is 126 cm2 (113 × 113 mm2), the window is made of titanium with surface density of 4.5 mg/cm2 and the filling gas is P-10 (90% argon, 10% methane). The window is supported by a steel supporting mesh.
The thickness of beryllium activation plate is determined by mean range of electrons coming from the decay of the reaction product (6He). It is about 5 mm in beryllium for the β– particles with energy 1.6 MeV. Taking also into account mechanical properties of beryllium, 2 mm thickness has been chosen for the beryllium activation plate. The plate with dimensions 100 × 100 × 2 mm3 and 36 g mass (99.0% purity) adjoins the steel mesh and is centered in relation to the window.
The counter’s calibration consists of several steps: measurements with radioactive β– and neutron calibration sources and a number of various Monte Carlo calculations of β– particle and neutron transport as well. The MCNP5 [15] Monte Carlo code with MCNP5DATA [16] cross section library has been used for above mentioned calculations.
Specially designed massive indium samples are adopted for angular neutrons distribution measurements (vertical and horizontal) that are used in the plasma experiment conducted on the PF-6 device. This choice is substantiated by relatively long half-life times of the neutron induced isotopes and the threshold character of the 115In(n,n’)115mIn nuclear reaction.
The radionuclides 115mIn and 116In have an important meaning for measuring the spatial distribution of neutrons emitted during plasma experiments performed on PF-6 device. These two isotopes of indium are the result of the following nuclear reactions:
n+115In → n’+115mIn(T1/2 = 4.48 h) → 115In + γ (Eγ = 336.241 keV; Iγ = 45.8%) n+115In → 116In(T1/2 = 54.29 m) → 116Sc + β + γ (Eγ = 1293.56 keV; Iγ = 84.8%) (4)
The first one is the inelastic scattering reaction induced by neutron with 115In nucleuses while the second one represents radiative capture of neutrons by the same nucleuses of indium. The above mentioned inelastic scattering reaction has the threshold equal to 340 keV. It means that this reaction is not sensitive for neutrons with energy below the threshold energy. Both mentioned radionuclides of indium are the gamma emitters and thus can be easily detected by gamma spectrometer.
Yttrium has only one naturally occurring stable isotope 89Y. The following reaction is considered:
Nuclear reaction of inelastic scattering of neutrons with yttrium nuclei has broad perspective to be implemented in plasma experiments. It is the threshold reaction that means it is more sensitive for primary fusion neutrons than widely used SACs.
89mY is the relatively short-lived radionuclide and because of that it is very useful (as BNAC) as the neutron monitor for repetitive plasma devices. Fusion neutron yttrium monitor (FNYM) does not need any neutron moderator to allow neutrons detection. Neutron monitoring is realized by simple counting of gammas emitted from activated metastable state of yttrium isotope.
During the preliminary experiment, the yttrium sample was put near the PF-6 chamber surface before each discharge. Its position was situated on the 90 degree to the main axis of the PF-6 device downwards and on the plain crossing the plasma focus chamber’s center. During a discharge the FNYM was activated and after that removed manually to the shielding house standing close to the device and measured. The removal of the sample took usually up to 20 s. The activity of 89mY (expressed in Bq) was estimated by the MCA software for the particular discharge time. The measurement of yttrium sample activity was performed with gamma spectrometry system equipped with a high purity germanium (HPGe) detector. The efficiency calibration of the spectrometry system consists of particular HPGe detector and activated yttrium sample put every time in the same position regarding the detector, which was assessed by the attached to the system software (ISOCS/LABSOCS) and detector numerical characteristics. After each measurement the yttrium sample was put again in this same position on the device’s place.
The gamma spectrometry system based on the HPGe detector equipped with multichannel analyser (MCA) is used in some of the above activation techniques. The detector is provided by the manufacturer with its numerical characterisation and software for mathematical calibration of the system (ISOCS/LABSOCS). This software that uses gamma photon transport calculation is based on the Monte Carlo Method, and it allows accurate determination of the spectrometer efficiency for many sample shapes, dimensions, and positions in relation to the spectrometer. That allows the elimination of traditional calibration sources and provides significant savings in cost and measurement time. In addition, the flexibility of these tools allows for excellent replication of the measured sample geometry resulting in improved accuracy over fabricated calibration source standards. Canberra, which is the producer of the above mentioned mathematical calibration software, declares that the typical manufacturing uncertainties are ±8–10% in the indeterminateness of the detector efficiency response from the mid-range (100 – 400 keV) to high energies. For energies less than 100 keV these deviations can be worse (around ±15% for the 241Am isotope; 60 keV emission energy). Some detailed features of the above-mentioned activation methods, calibration procedures and their MCNP support calculations may be found in [17].
Neutron spectral technique for the time-of-flight measurements
Neutron spectra with and without the above-mentioned simulator of a NFC are investigated with PF-6 device by means of time-of-flight (TOF) methodology. For this purpose two mobile measuring stands for experiments designed to work in a harsh electromagnetic environment are used. The base for each measuring stand is the cabinet, which is in fact, a Faraday cage featuring outstanding EMC shielding. The special, highly conducting electrical contacts system secures the very effective shielding against electromagnetic interference in wide frequency ranges (80 dB in the range from 30 MHz to 300 MHz, 60 dB in the range from 300 MHz to 1 GHz and 40 dB for 3 GHz).
During the measurements the stand is galvanically separated from the mains lines and the experimental device under test: only the optical medium is used for the communication (i.e., triggering, time marking, and data transmission) with the devices located out of the stand. Therefore the measuring stands are equipped with optical mating sleeves. They end with fiber-optic (FO) patchcords inside the cabinets. This ensures feeding all kinds of optical signals in and out of the stand. The signals can be used for synchronization (such as trigger pulses or time markers) or to linking the measuring instruments with the optical Ethernet network (for data transmission or remote control). The stands are equipped with the converters needed for two-way signal conversion. These devices can convert the electrical signals into optical ones and vice versa (Figure 4).
Figure 4: The elements of mobile measuring stands used for powering management and optical communication [18].
All devices inside the stand are battery-powered. They use its own sources of energy, and other devices are supplied from the UPS that is installed inside the stand.
The hybrid module is equipped with the classic photomultiplier tube (PMT) having twelve linearly focusing dynodes. It is used as the main detector/amplifier of the light pulses. The conversion of the ionizing radiation into the light occurs in the fast organic scintillators (so a PMT+S). Modular design of the probe and additional optical coupling elements enable using the scintillators from 45 to 120 mm of diameter range (Figure 5). Typically the scintillators of 45 mm diameter and of 50 mm thickness are used. Such thickness is close to the mean free path of neutrons of 2.45 MeV energy.
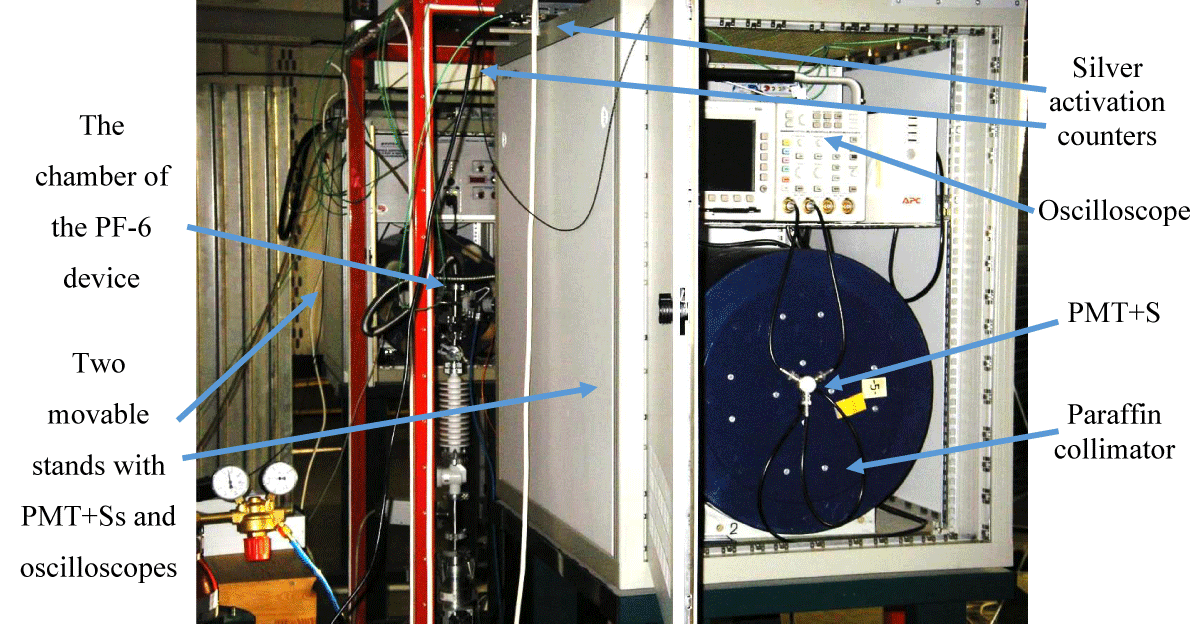
Each PMT+S (a block named subsequently TOF-1 or TOF-2) is placed inside the paraffin collimators, and there is a 2-mm lead foil in front of the collimator. It is done to prevent illumination of the photomultiplier tube (dynodes) and its scintillator by scattered neutrons and soft X-rays correspondingly coming not from the source. The oscilloscopes are triggered through the fiber optic cables. In Figure 6 one may see two stands near the PF-6 device with the open door showing PMT+S and an oscilloscope and with the Ag activation counters of their roofs. At the TOF technique as it is known a temporal behavior of the neutron emission of the ns-pulsed source reflected in the pulse shape of the PMT+S positioned at the close vicinity to the generator (PF-6 device) is converted at a certain distance from it into the spectral characteristics of neutron radiation.
Figure 6: Experimental complex for measuring the neutrons field produced around the PF-6-based neutron source with two sets of detectors (silver activation counters and PMT+Ss).
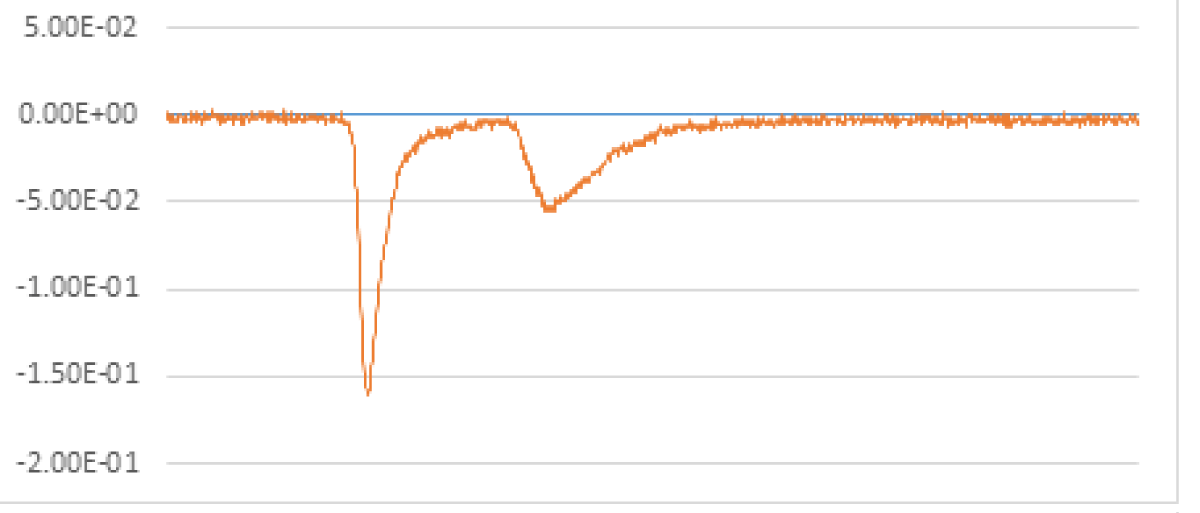
Figure 7 demonstrates an oscilloscope trace of a cosmic radiation giving information on the temporal resolution of the FNSP used in the experiments: it appears to be equal to 2.6 ns of its full width at half maximum (FWHM).
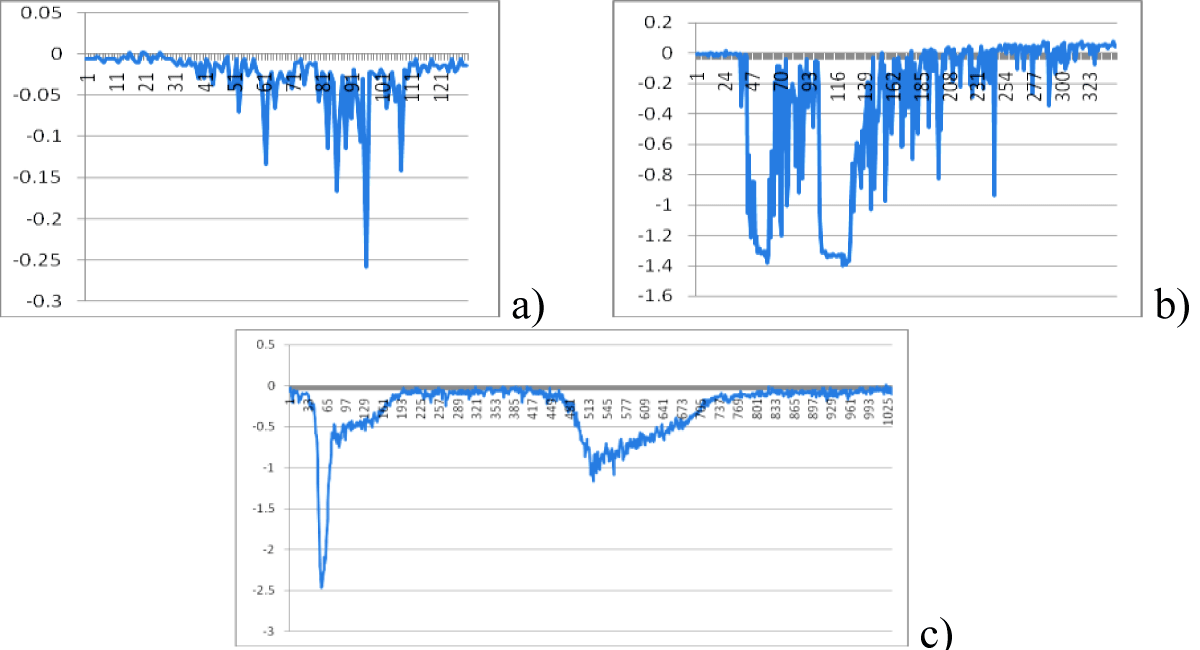
We have provided a first set of experiments with the PF-6 device in almost absence of the scattering objects using PMT+S probes of three types that have three dissimilar time resolutions [18]: 0.3, 1.3 and 2.6 ns (see below in the Figure 8 the oscilloscope traces for low (a), medium (b) and high (c) intensity of hard X-rays and neutrons).
Figure 8: Three shots with low, medium and high intensity of hard X-rays (1st pulses) and neutrons (2nd pulses); in the last case all flashes produced by individual X-ray photons and neutrons within a scintillation block are merged, and the PMT starts to work in the “current” mode.
From these oscilloscope traces one may see that at a high-intensity of the X-ray and neutron radiations our photomultipliers are working in a “current mode of operation” (Figure 8c) rather than in a “single-pulse” recording (a and b) regime.
So the plan for the first step of experiments on the NFC simulation characterization is to investigate the angular characteristics of neutron radiation of the PF-6 device itself. It is provided in the most “clean” hall with a help of two stands in such a way that one stand (No.1) had a fixed position in a direction perpendicular to the Z-axis of the PF-6 chamber whereas the other (stand No. 2) was moved around the PF-6 device. At the second step this procedure has to be repeated in a presence of the simulator (a chamber of the PF-1000U facility) to see distortions introduced to the neutron field due to scattering and attenuation of 2.45-MeV neutrons on elements of the simulator and the premises constructions.
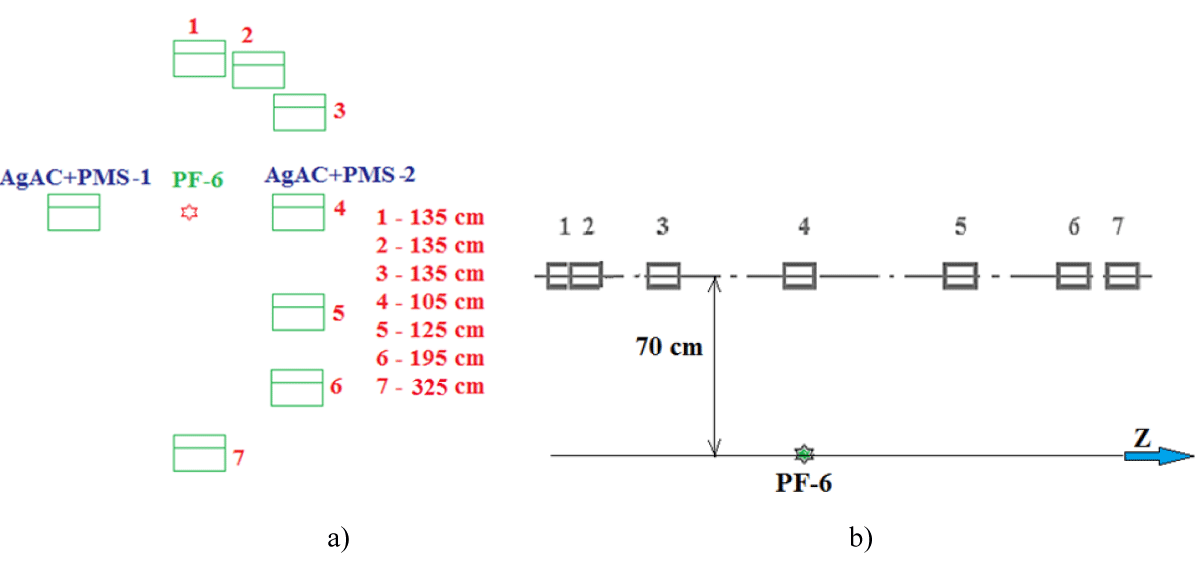
General arrangement of the two stands with SACs and other activation detectors as well as with two stands containing PMT+Ss-related equipment is shown in Figure 9 in the positions of a “clean-room” condition (a) and near the simulator of a NFC (the big chamber of the PF-1000U facility) (b). One has to take into account a height diversity of the positions of PMT+Ss and SACs: the PMT+Ss are placed in the plane of Z-axes of the PF-6 and PF-1000U chambers (directed horizontally in parallel to the floor) whereas the SACs are 70 cm higher (as it is seen from Figure 9).
Figure 9: Steady-state position of the stand No. 1 (detectors 1&2) and a movable stand No. 2 (probes 3&4) in its position No. I (see later).
Numerical simulations
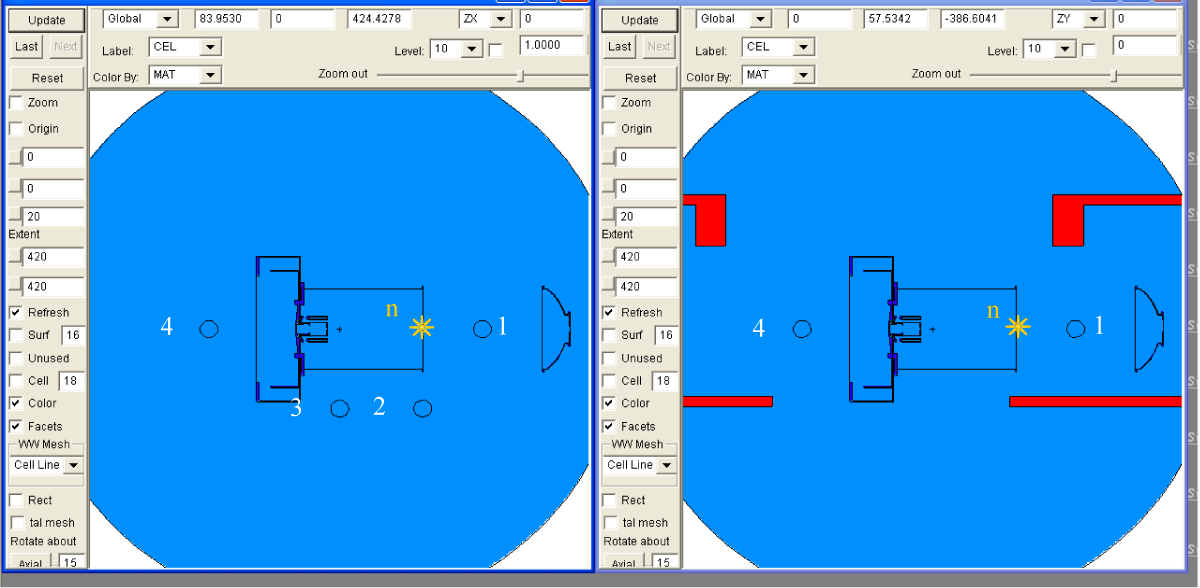
Geometrical model: Geometrical model of simulated experiment is simplified. It contains PF-1000U stainless steel vacuum chamber with collector, set of electrodes with insulators, the concrete floor and ceiling. The lid of the chamber is opened and moved 2 meters away. Therefore there is an air in the chamber. The origin of coordinates is in the center of the anode end. The X-axis is horizontal, Y-axis is vertical, Z-axis is on the axis of symmetry of the chamber. Two cut-views of the model are presented in Figure 10.
Figure 10: Two cut-views of the geometrical MCNP input: ZX plane on the left and ZY plane on the right. The air is blue, the concrete floor and ceiling are red. Numbered spheres are “detectors”, the yellow star with the letter “n” denotes neutron source.
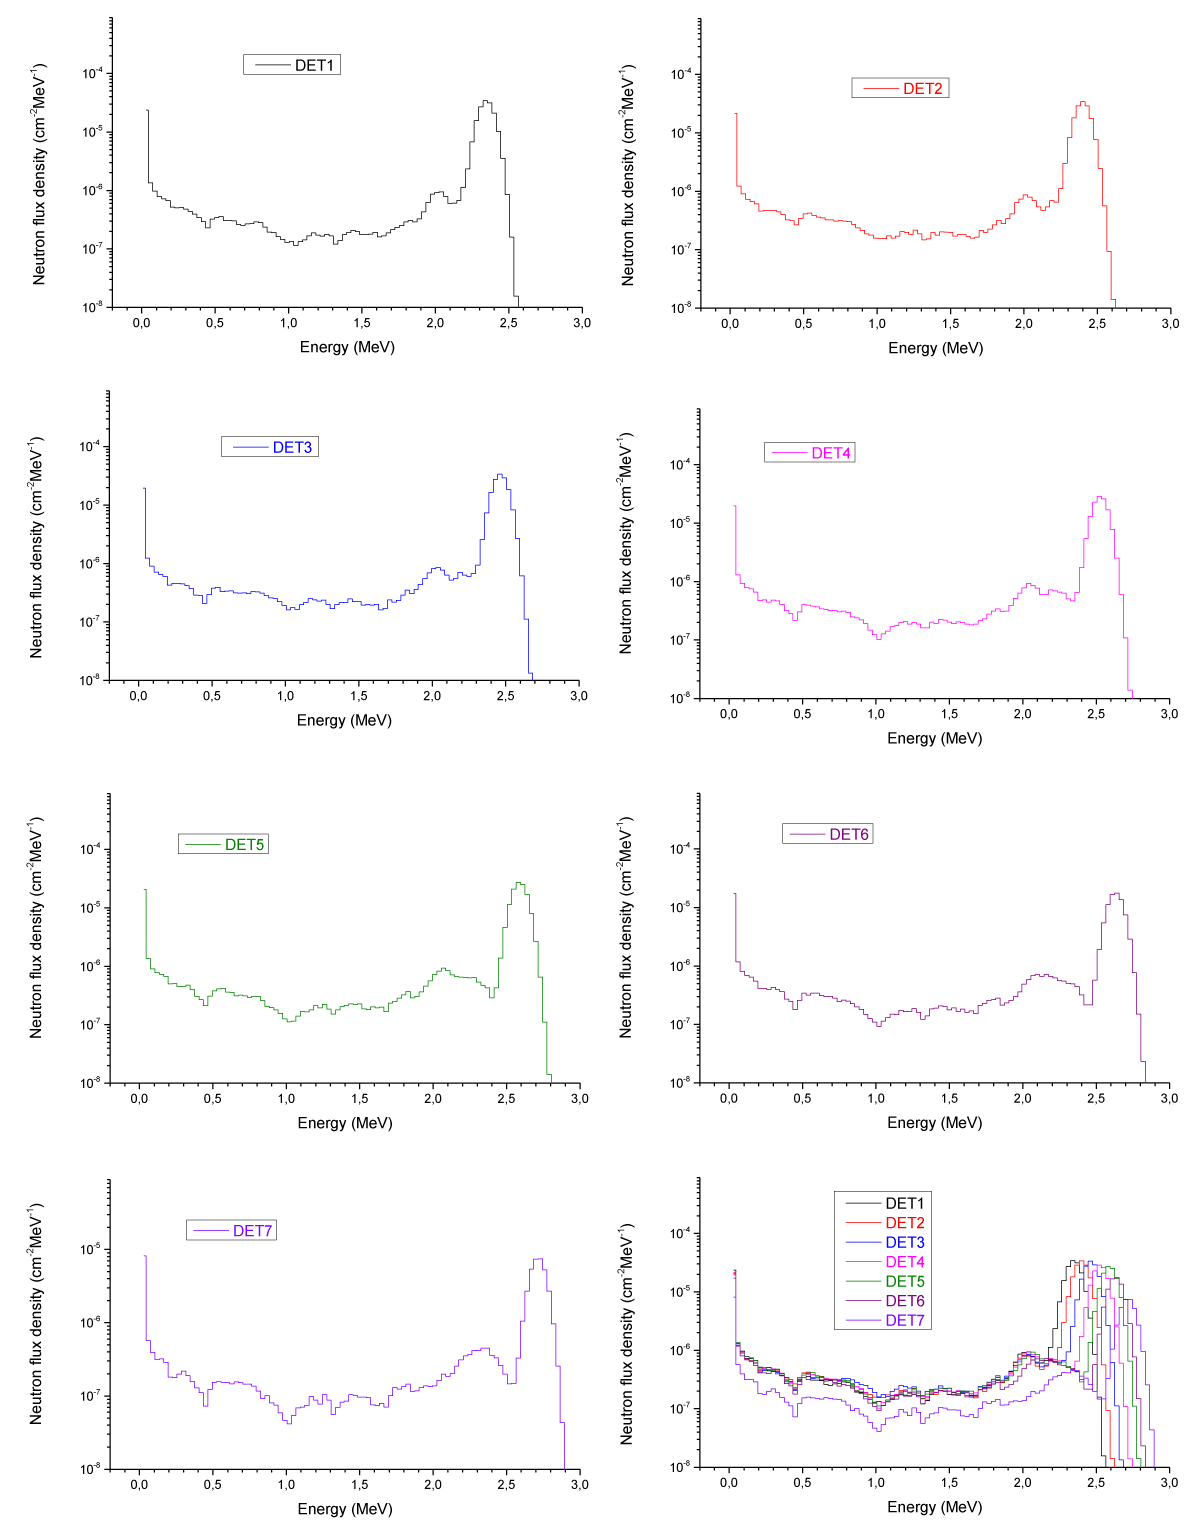
Neutron source: The source of neutrons is point and lies on the Z-axis near the end of the opened chamber of the PF-1000U facility. The coordinates are (0, 0, 160) cm. The energy spectrum of neutrons emitted from the source is Gaussian. The most probable energy of the Gaussian spectrum depends on the direction of neutron emission. Neutrons emitted in –Z direction (180° in respect to Z-axis) have energy around 2.7 MeV, neutrons emitted in XY plane (90° in respect to Z-axis) have energy around 2.45 MeV, and neutrons emitted in +Z direction (0° in respect to Z-axis) have energy around 2.3 MeV. All intermediate directions have corresponding intermediate energies. The FWHM of all Gaussian peaks is taken to be equal 120 keV. The neutron emission is anisotropic. The “intensity” of emission of neutrons for –Z, XY, +Z directions is 8.8, 4.8 and 3 correspondingly.
The code: Calculations have been carried out by means of the MCNP code [X-5 Monte Carlo Team, MCNP - A general Monte Carlo N-particle transport code, Version 5, Los Alamos National Laboratory, LA-UR-03-1987, 2003]. Used cross-sections have been derived from the ENDF/B-VI library.
Tallies: It was decided to calculate neutron flux density in 4 spheres of air placed in selected positions. The centers of the spheres have following coordinates in cm: sphere 1 (0, 0, 260), sphere 2 (-140, 0, 160), sphere 3 (-140, 0, 20), sphere 4 (0, 0, -200). That locations correspond to the angles of 0°, 90°, 135° and 180° between the Z-axis and the segment connecting source with detector. All spheres have the radius equal to 15 cm.
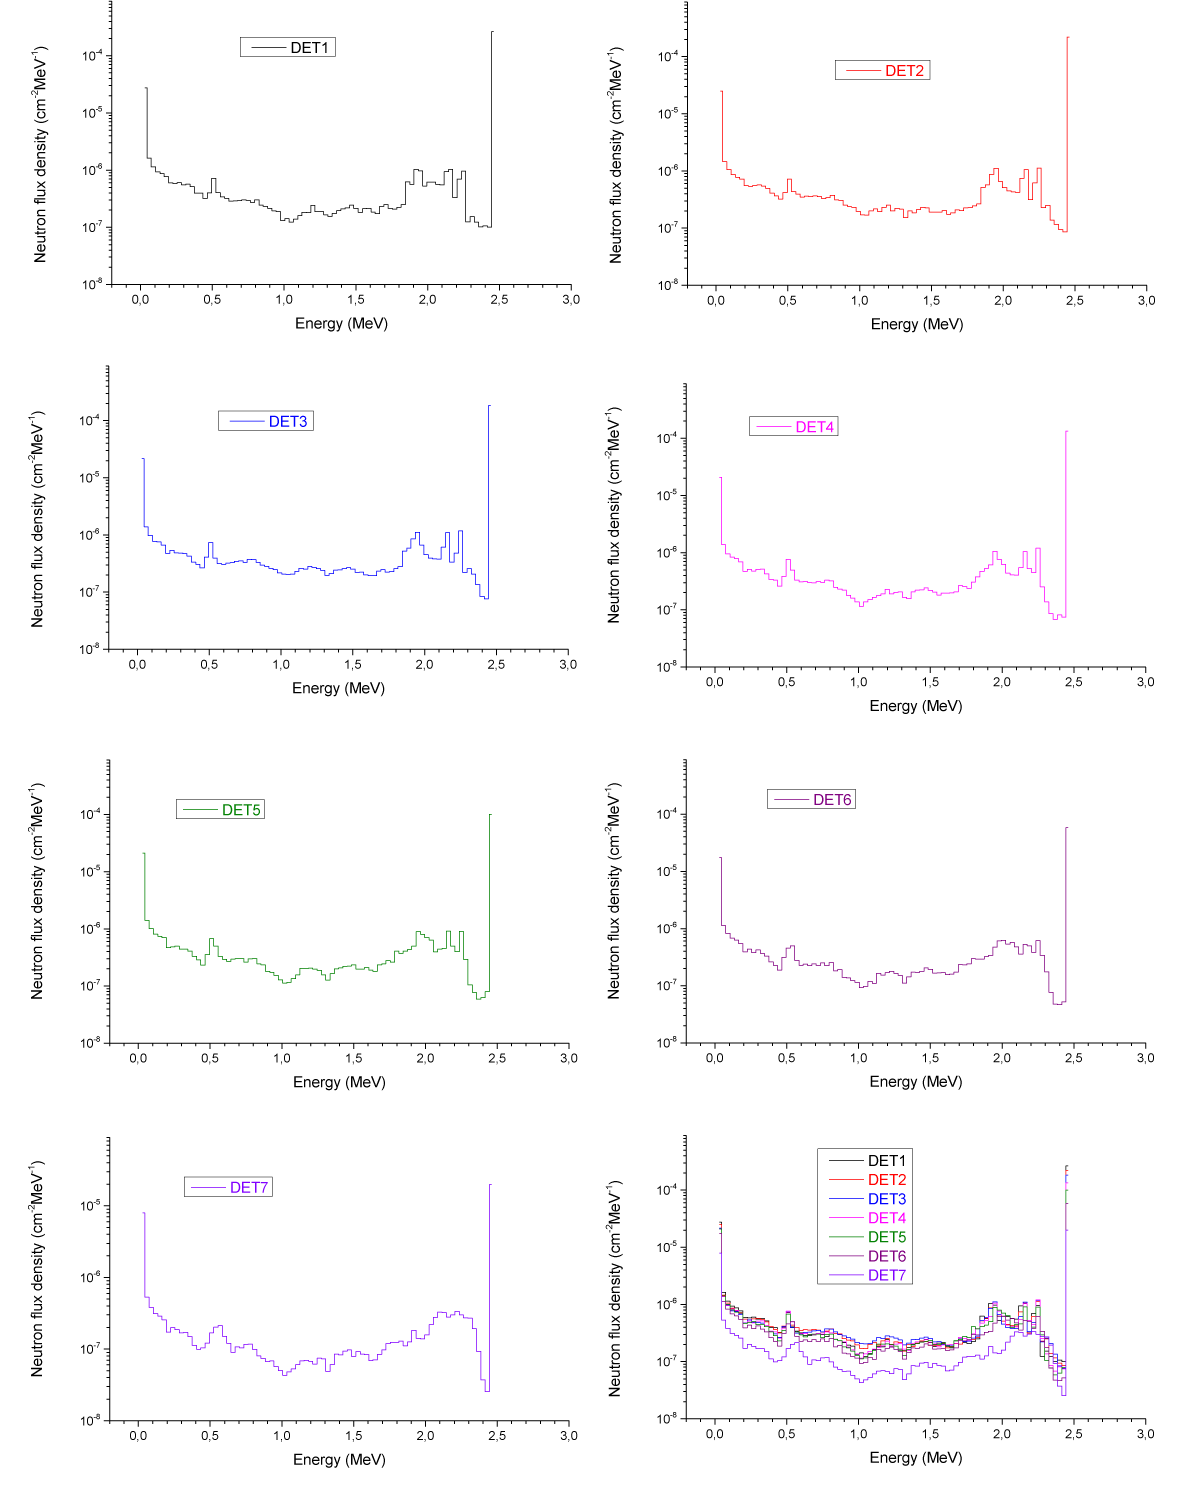
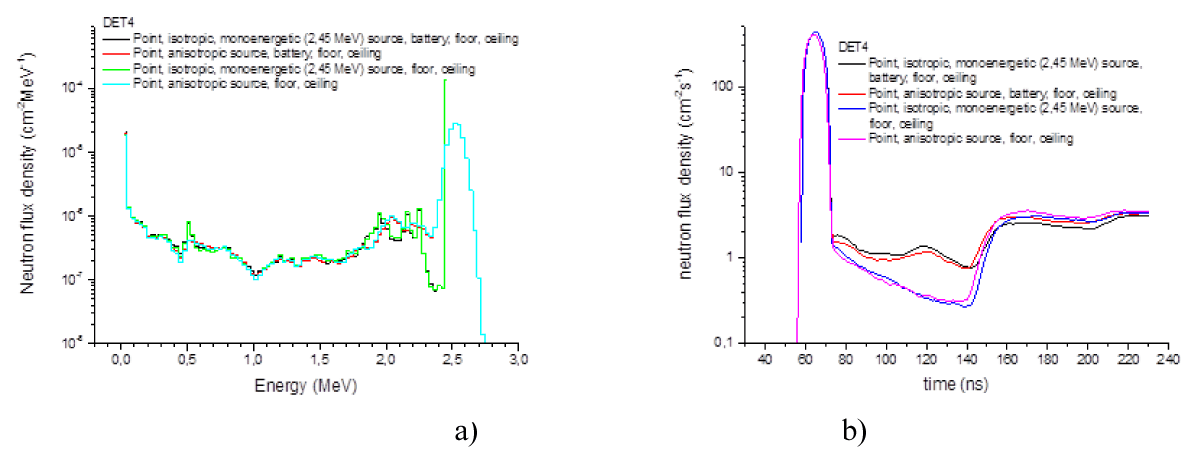
Results: Below we set out several results of calculations obtained for different situation of the PF-6 device (with and without capacitors, environment, different features upon our measurements of the neutron source, etc.) to understand possible influence of these features upon our measurements. Some examples of these calculations are presented in the energy and time-of-flight coordinates and in log and linear scales (Figures 11, 12 and 13 correspondingly).
Figure 11: PF-6: point, isotropic, monoenergetic (2.45 MeV) source with battery, floor, and ceiling.
Figure 13: PF-6: various calculations of neutrons versus energy (log scale) for the detector position 4 (a) (see Fig. 9): various calculations of neutrons versus time (log scale) for the detector position 4 in the “clean-room” conditions (b)
Then we came to the simulations of the interaction of neutron flashes generated by the PF-6 device with the PF-1000U chamber simulator (the geometry is presented in Figure 10).
The lid of the chamber of the PF-1000U facility is opened and moved 2 meters away. Therefore there is an air in the chamber. The origin of coordinates is in the center of the PF-6 anode end. The X-axis is horizontal, Y-axis is vertical, and Z-axis is on the axis of symmetry of the chamber.
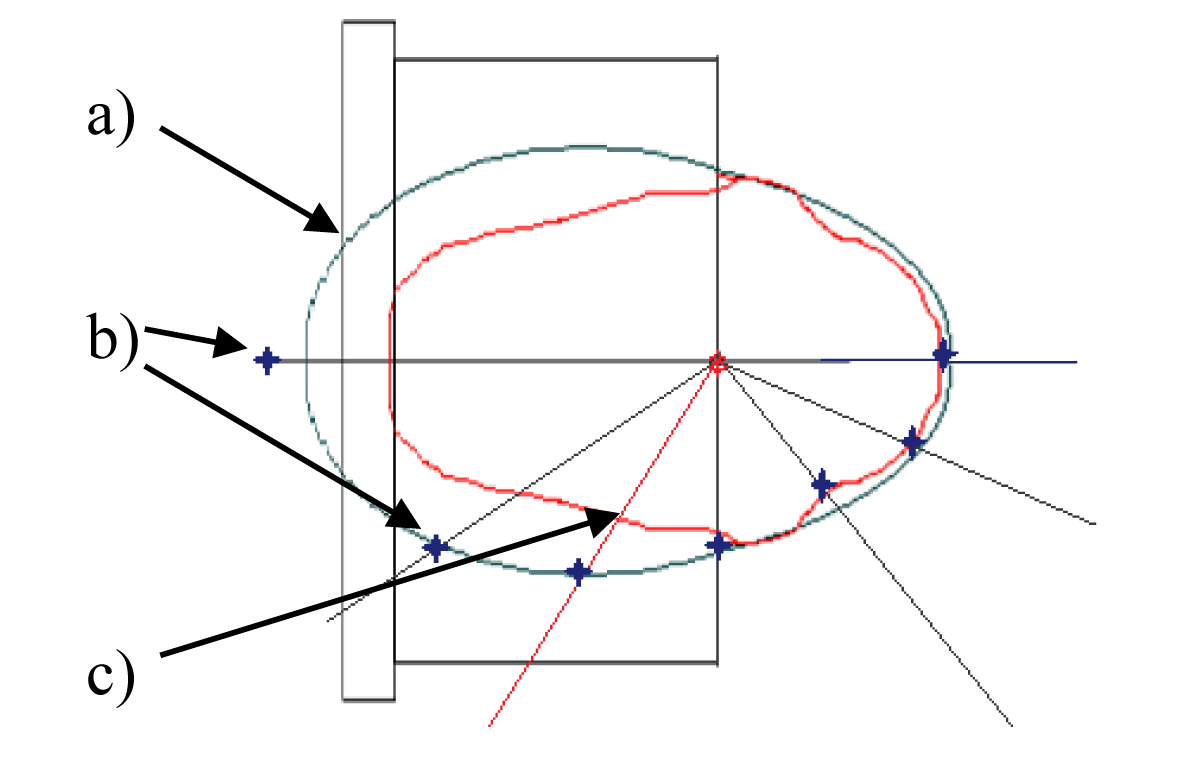
Results of the preliminary calculations of the normalized flux density of neutrons from the PF-6 device in vacuum (green – a) without its auxiliary equipment (cables, transformers, etc.), experimental points for the same situation (so the PF-6 device is with its equipment) (b) and MCNP calculations for the case after neutrons scattering (red – c) in the chamber walls of the PF-1000U facility without its electrodes are presented in Figure 14. One may see that the coincidence of experiments and modeling is rather well.
Figure 14: Preliminary calculations of the normalized flux density of neutrons from the PF-6 device in vacuum without its auxiliary equipment (green – a), experimental points for the same situation (b) and MCNP modeling of neutrons scattering (red – c) in the chamber walls of the PF-1000U facility without its electrodes.
Experimental methodology
Neutron activation techniques application for the “clean-room” conditions:
So the plan for the first step of the characterizations experiments by activation methods is to investigate the angular characteristics of neutron yields of the PF-6 device itself. It is provided in the most “clean” hall.
However it must be noted here that these conditions are not absolutely “clean”, and the measurements with activation counters do not give the real “absolute” Figures for the neutron flux in a particular direction. Indeed, the device itself has 4 capacitors filled with a castor oil (scatterers) that are placed behind the chamber in a lower position than that by about 50 cm. Besides in this “empty” hall the concrete floor and ceiling are presented that are in distances of about 1.5 meters from the DPF chamber (walls of the hall are quite far from the chamber – in about 10 meters – and they cannot influence the SAC readings). In addition 4 coils of cables and 4 separating transformers are the elements of the PF-6 construction that may influence the measurements. All of these parts are rather bulky scatterers/absorbers. Also the accurate absolute calibration of the silver activation counters has not been provided in this very environment.
Because of these circumstances later in this paper for the term “absolute” neutron yield, which is measured in each point of the hall by SACs, the data will be used that represent in fact the values correlated with all other instruments’ readings in the other positions. So these readings are the “relative” measurements, or the absolute measurements with the identical but unknown normalizing coefficient. Nevertheless from these data a diagram of neutron anisotropy can be deduced in both cases, i.e. in “clean” conditions and in the modelling experiment: in each point of a movable stand the experimental conditions are the same in this hall – as well as in the simulation experiment except a presence of the PF-1000U chamber.
During the experimental simulations the neutron yield (YnTOTAL) is monitored using two SAC(s) either enveloped into the cadmium foils of 2 mm thickness or without this foil. Only the best shots of the PF-6 device when the YnTOTAL magnitude was in the range of 108 - 109 neutrons per pulse is taken into account.
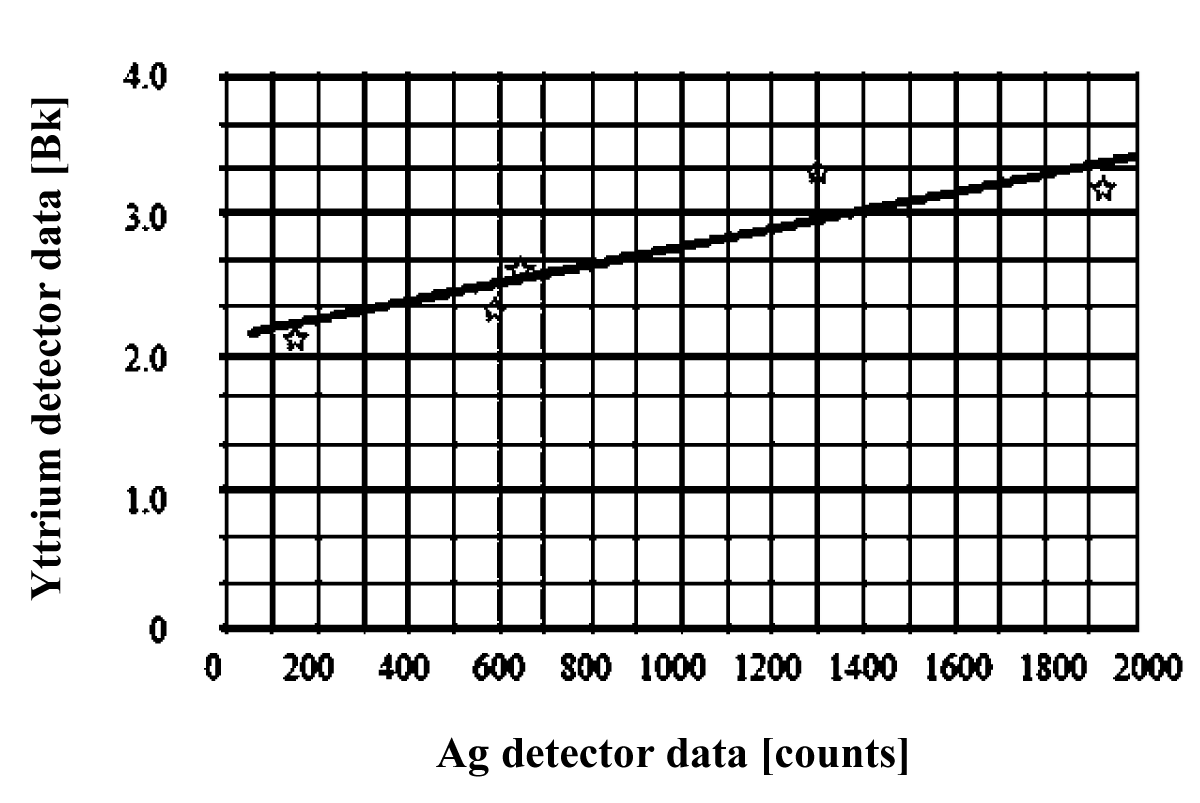
Side by side with two silver activation counters (SACs) the activation detectors based on yttrium is used. Our yttrium neutron detectors give us data that correlated with the absolute neutron yield obtained from silver AC (Figure 15). One may see a liner dependence of yttrium activation expressed in [Bk] on the number of the silver detector counts.
Figure 15: Data of the absolute neutron yield measured during the experimental session with yttrium and silver activation counters averaged over 10-20 shots for each point of the graph.
Same or other calibration procedures supported by MCNP calculations of transport of the particles have demonstrated the analogous linear dependences with SACs and other above-mentioned activation detectors in “clean-room” conditions [17].
Theoretical analysis of anisotropy of yields and spectral characteristics as applied to a DPF (i.e. their “ideal” values in various directions under certain angles to the Z-axis of the PF-6 chamber) is presented in the paper [1]. Here we shall mention that in the theoretical diagram of yields the following features are taken into consideration [18]: 1) a beam-target mechanism of neutron production; 2) gyrating particle model of it in relation to a DPF device; and 3) a special insert made of high refractive material (rhenium) in the center of the PF-6 anode. In these conditions it looks like an oval around the source that has a bit prolonged shape in the direction of the fast ion movement.
During our first experiments the characterization of the source itself (the cross-calibration measurements) was fulfilled. The successive 33 shots with SAC-1 and SAC-2 placed at two sides of the PF-6 device perpendicular to the Z-axis of its chamber were provided. Then preserving the position of the stand with SAC-1 the assembly No. 2 was moved along the line around the source with 7 different positions shown in Figure 16.
Figure 16: Positions of the steady-state stand No. 1 and the movable stand No. 2: top view – a) and side view – b) during measurements of the angular distribution of “absolute” neutron yield by SACs for the PF-6 device in a “clean” situation.
After these measurements we have to move the PF-6 device and both stands No. 1 (SAC-1 and TOF-1) and No. 2 (SAC-2 and TOF-2) to the PF-1000U chamber and to repeat the same measurements around our simulator of the tokamak chamber section (Figure 21). We intended to compare our data obtained in this configuration (Figures 21 and 9b) with the previous data gained in “clean” conditions (Figures 20 and 9a) as well as to monitor data from the movable stand No. 2 in confrontation to the data obtained in a steady-state position by the stand No. 1.
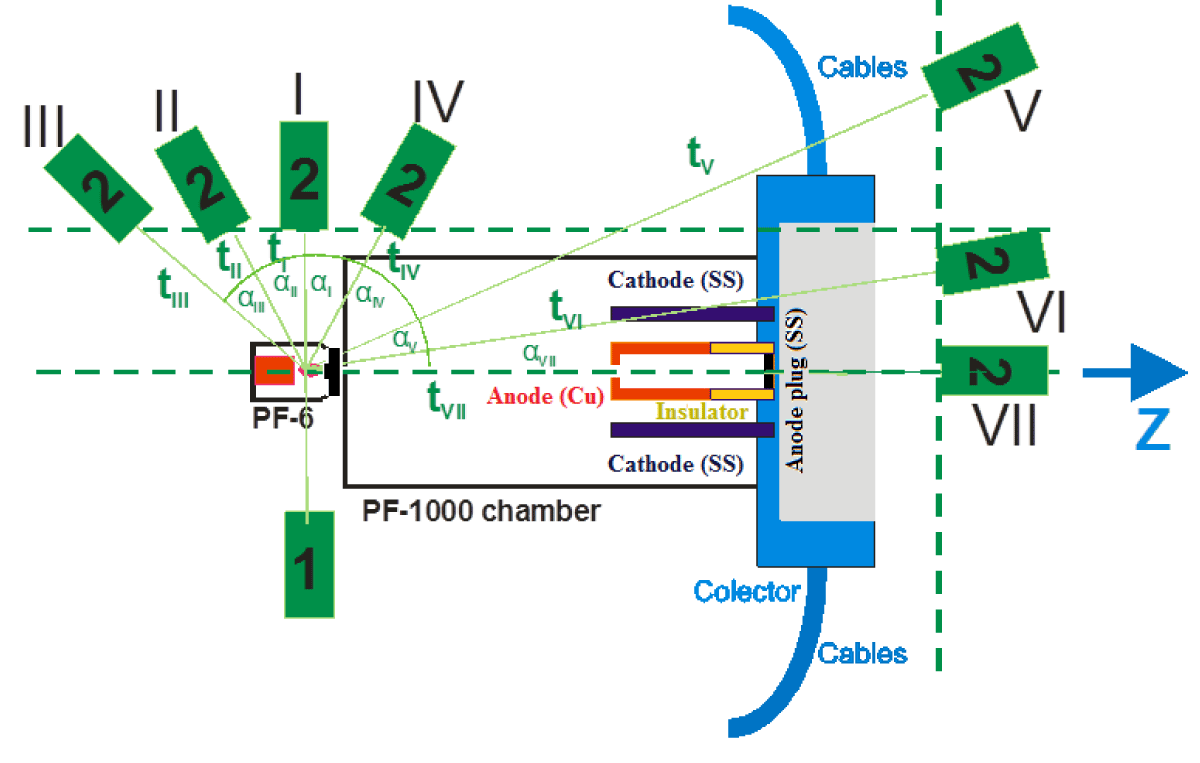
Figure 17: A schematic representation of a steady-state position of a stand No. 1 (i.e. a stand with the SAC-1 and the PMT+S probe TOF-1) and seven different positions of a movable stand No. 2 during the simulation experiment (i.e. a stand with the SAC-2 and the PMT+S probe TOF-2) – top view.
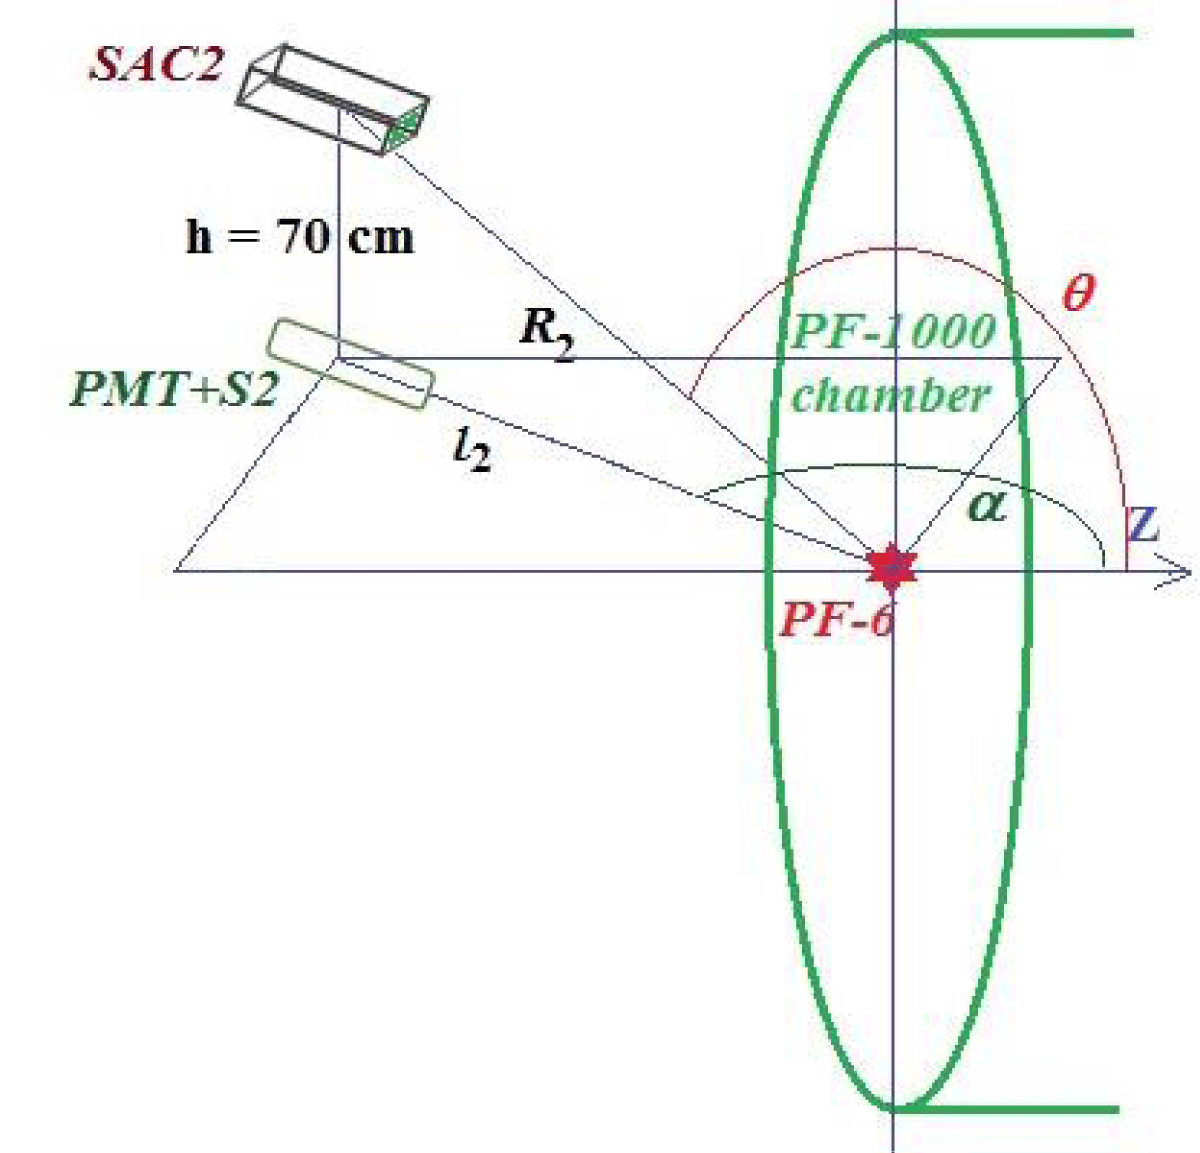
Figure 18: Distances l2, R2 and angles α, θ in the plane of the SACs, and the real 3-D angles from the source to the SAC2, depicted for a hall with a simulator.
Figure 19: Typical OT of hard X-ray (1st – ΔtFWHM = 10 ns) and neutron (2nd) pulses of the PF-6 device (neutron pulse: ΔtFWHM = 20 ns).
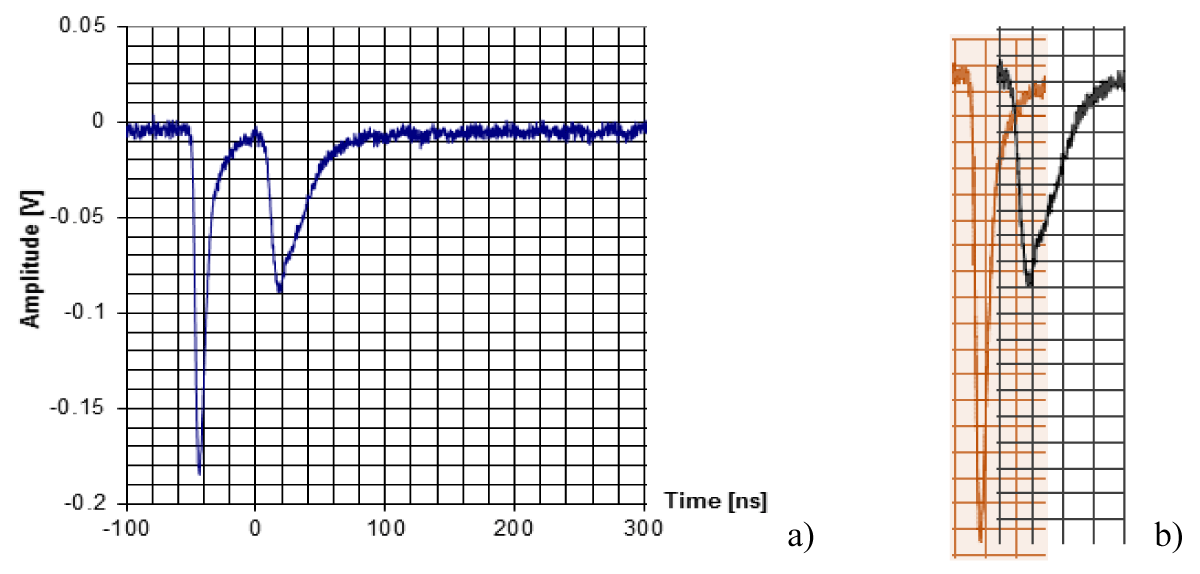
Figure 20: Initial (measured – a) and corrected for TOF positions of hard X-ray (1st) pulse and 2.45-MeV neutron (2nd) pulse (b).
The first experimental data for the angular distribution of the absolute neutron yield are obtained for the PF-6 device “itself”. These measurements are made with subsequent data processing taking into account that the Ag activation counters (SACs) are located not in the horizontal plane of Z-axis of the PF-6 chamber (as it may seem in Figure 20a) but they are 70 cm higher (Figures 9 and 16b). The Z axis covers the axis of symmetry of the PF device. The X axis is horizontal, so the Y axis is vertical. For any (x,y,z) point is the angle between vector and the Z axis. This gives the spatial angles θº that differ from those “flat” angles αº depicted in Figure 20a. The actual values of the angles in a 3-D space θº that is so important for a subsequent comparison of the experimental results with the MCNP calculations are presented in a Table 2.
Table 2: Locations of SAC-2 (stand No. 2). |
|||||
| Position of the detector SAC-2 | “Flat” angle α º (top view) |
Coordinates of the detector SAC-2 | |||
| x [cm] | y [cm] | z [cm] | 3-D angle θ º | ||
| 1 | 180º | 0 | 70 | -135 | 153º |
| 2 | 157º | 54 | 70 | -127 | 145º |
| 3 | 129º | 105 | 70 | -85 | 124º |
| 4 | 90º | 105 | 70 | 0 | 90º |
| 5 | 57º | 105 | 70 | 68 | 62º |
| 6 | 33º | 105 | 70 | 164 | 38º |
| 7 | 0º | 0 | 70 | 325 | 12º |
The procedure looks as follows. There are 2 cages. Each cage have a PMT+S (TOF) probe placed in a horizontal plane on the level of Z-axis of the PF-6 chamber and a silver activation counter (SAC) placed 70 cm above the PMT+S. It is known that energy of neutrons produced in DPF and irradiated in all directions perpendicular to Z-axis (i.e. for the detector SAC-1 in its fixed place and for the detector SAC-2 in a position 4) is equal to 2.45 MeV for deuteron energy of 100-150 keV ([19]).
One cage (No. 2 with SAC-2) is movable whereas another cage (No. 1 with SAC-1) is placed permanently on the same position at 90° in respect to the Z-axis of the PF-6 chamber.
Step 1: Background data are measured by both SACs about 5 times and average Figures (usually it is ~ 30-40 counts in our case) are calculated for each set of shots.
Step 2: It is assumed that for symmetrical positions of both SACs at 90° in respect to the Z-axis of the PF-6 chamber (position No. 4 for a movable SAC-2) neutron yields are equal (it was checked many times). So their relative sensitivities are computed by dividing Yn1/Yn2(position 4) = Q1. This will be a normalization coefficient Q1 for all subsequent calculations for different positions of a SAC-2 and for dissimilar neutron yields in various sets of shots. E.g. in this set of shots Q1 = 1.374.
Step 3: All readouts obtained for the SAC-1 and for different positions of the SAC-2 (Yn1(i) and Yn2(i)) are summarized for about 10-20 “good” shots of the same session, and the average Figures for each set of shots Yn1(i)measured and Yn2(i)measured are calculated after subtracting background Figures.
Step 4: Then the “real” values of the SAC-2 are calculated taking into consideration its sensitivity:
Yn2(i)real = Yn2(i)measured×Q1 (6)
Step 5: Now distances r2i from the neutron source to the SAC-2 are calculated in all its positions and a normalization procedure is provided taking into account the real distances from the source to the SAC-2: rSAC-2. So using the r-2 law the coefficients for neutron yield in each position of the SAC-2 are obtained:
ki = (rSAC-2i /rSAC-2(position 4))-2 (7)
Step 6: Multiplying the above “real” neutron yields Yn2(i)real by these coefficients ki and normalizing them by the Figure for Yn1(i) in each set of shots “i” an anisotropy distribution coefficient A in the “empty” room is obtained:
A = ki (Yn2(i)real / Yn1(i)) (8)
Namely by this way the results of measurements and their processing that are depicted in a table and presented in the form of a polar graph as a visual aid are presented in the paper [1]. It this article one may also find a discussion of peculiar divergences of the experimental data from the theoretically expected ones and the particular elements of the device PF-6 that distort the ex ante neutrons anisotropic picture. One of the particular results of the comparison of the experimental data with the MCNP calculation is that among possible candidates of the PF-6 systems for the neutron theoretical anisotropy distortions – cables, transformers and capacitors – namely bundles of cables appeared to be responsible for the effect.
Measurements of anisotropy of neutron emission using PF-6 device with an object simulating a section of a toroidal chamber of a mainstream fusion facility (the PF-1000U chamber):
After providing measurements in “clean” conditions (a so-called “empty” hall), the PF-6 device and two movable stands are moved to a close vicinity to the PF-1000U chamber to see distortions of the neutron field produced in those observations by the simulator – a chamber of the PF-1000U facility (Figures 9b and 17).
The procedure on measurements of anisotropy of neutron yields obtained at the modelling of an influence of a simulator of a tokamak chamber section by means of a discharge chamber of the PF-1000U facility in a geometry shown in Figure 9b and Figure 17 is about the same as above for the case of the empty hall. However in our case there were certain differences. Namely the distances from the neutron source to the Faraday cages No. 1 and No. 2 were dissimilar in this case: in the horizontal plane of the PF-6 chamber (Figure 17) these distances, i.e. the distances between the stands No. 1 and No. 2 and the PF-6 chamber, were 90 cm and 105 cm in the PF chamber’s plane correspondingly. Because of this an additional coefficient following by an inverse quadratic law of neutron yield dependence on the distance has been introduced. Also positions of the moveable stand have been someone else. Calculated for all these positions I through VII of the real distances R2 from the PF-6 chamber to the SACs (with taking into consideration that our SACs are placed 70 cm above the horizontal plane of the source and its Z-axis), the angles α in a plane of SACs (i.e. a top view) and the real angles θ in a Cartesian 3-D system of coordinates (with a supposition of independence of the neutron yield in a vertical plane perpendicular to Z-axis in each position) (Figure 18) are presented in a Table 3. The real distance R1 and the angle θ between Z-axis of the chamber and the SAC No.1 is 114 cm and 90°.
| Table 3: Data on the distances l2, R2, the angles α in the plane of the SACs, and the real 3-D angles θ from the source to the SAC-3, in a hall with a simulator (the PF-1000U chamber). | |||||||
| Positions of the SAC-2&PMT+S4 | III | II | I | IV | V | VI | VII |
| Distances l2[cm] from the source and the stand No. 2 in a plane of Z-axis of both chambers (i.e. between the source and the TOF-2 of the stand No. 2) | 190 | 142 | 110 | 150 | 450 | 368 | 360 |
| Real distances R2[cm] from the source and the SACs of the Faraday cage No. 2 (i.e. between the source and the SACs of the stand No. 2 that are 70 cm higher) | 202.5 | II | 130.4 | 165.5 | 455.4 | 374.6 | 366.7 |
| Angles α°between Z-axis of the PF-6 chamber and the Faraday cage No. 2 in the plane of PMT+Ss (i.e. a top view on a plane of SACs that is 70 cm above the plane of the position of the PF-6 chamber) – a so-called “flat” angles | 135°22´ | 129°13´ | 90° | 42°47´ | 36°56´ | 12° | 0° |
| Real angles θ° between Z-axis of the PF-6 chamber and the directions SACs No. 2 in a Cartesian system of coordinates, Fig. 13 | 139º55´ | 124º38´ | 90° | 51º51´ | 37º47´ | 16º05´ | 11º |
The procedure of the calculation of neutron anisotropy was the same as it was for the “empty” room, and it was fulfilled taking into account a quadratic law of a neutron yield change in space and a difference in the sensitivity of the SACs. Results are depicted in the paper [1]. In particular one may clearly see that there is a strong influence of the PF-1000U chamber electrodes in the directions V, VI and VII where the SAC-2 registers the neutron flux through the PF-1000U chamber electrodes.
Data obtained on anisotropy of the neutron yield in the hall with a simulator (the PF-1000U discharge chamber) may be found in the paper [1] presented together with the discussions of the influences of details of the simulator. It is clearly seen there the most important feature of the measurements: because of the central part of the chamber of PF-1000U the SAC-2 readings are dramatically decreased.
Neutron spectral measurement procedure by time-of-flight technique:
The typical fast probe oscilloscope trace (OT of the PMT+S-1, i.e. obtained by the TOF-1) for the modelling experiment recorded by the fixed stand No. 1 is given in the Figure 19.
First the measurements in the clean-room conditions have to be made. The PMT+S probes No. 1 (fixed) and No. 2 (movable) are positioned in the horizontal plane coinciding with a Z-axis of the PF-6 chamber. To deduce the angle tracking neutron spectral distribution the time-of-flight (TOF) method has to be used. We preserved the PMT+S-1 position (TOF-1) from one side of the DPF chamber (at 105 cm) but moved PMT+S-2 stand (TOF-2) along the steps I through VII shown in Figure 17 (view from the top).
At the angle 90o to Z-axis of the chamber the neutrons’ energy is 2.45 MeV [8]; so for the detectors Nos 1 and 2 placed at 1.05 m we have to move forward the hard X-ray pulse by 3.5 ns (vhxr = 3×10⁸ m/s) and the neutron pulse by 48.5 ns (vn = 2.1667×10⁷ m/s) in a manner shown in Figure 20a and 20b. After this procedure (averaged over 33 shots) the delay time of neutron pulse maximum inside the chamber in relation to the hard X-ray pulse front was found to be equal to Δt = 25 ns for both stands in this set of experiments (however it changes in other sets probably depending on the DPF operational regime). Note that typically the rise-time of the hard X-ray pulse is equal to the fast probe temporal resolution.
These measurements gave us the base for the subsequent measurements and corrections provided for all other neutron pulses registered at different angles and at dissimilar distances from the PF-6-based neutron source. So in each shot we started from the front of the hard X-ray pulses, moving neutron pulse to the point delayed to the front by Δt.
However we must say that this time delay Δt depends on initial gas pressure, charging voltage and some other parameters. So in this set and later we have to check this Figure in each shot by using fixed stand No. 1. Then we have an opportunity to calculate TOF of this neutron pulse to the detector No. 2 in each specific position. This measured time of flight can easily be recalculated into the energy of this neutron group producing the neutron pulse maximum by a formula taking from [17]:
EMeV = (72.24 lm/tns)2 (9)
where neutron energy EMeV is in [MeV], distance lm is in [m] and time of flight tns is in [ns].
Results of calculations at usage of the above procedure and formula give the angle tracking of the neutron spectral distribution in the space around our PF-6 device in a “clean” room conditions.
One may observe here that the energy data measured for the “forward” directions are higher by about 15% compared with usually obtained in such experiments. It is correlated with the data on neutron anisotropy and gave us the arguments in favor of higher value for the most representative energy of fast deuterons generated in our experiments with the PF-6 device having a rhenium anode’s insert.
The analysis has shown that this unexpected feature is connected very likely with the specificity of the anode construction in this case. Namely instead of an orifice usually made in the anode center to prevent evaporation of debris by the electron beam we had in this case a special central insert made of rhenium. For unknown reason it helps to produce the most representative group fast deuterons of higher energy compared with a common case. The same situation we have observed about 30 years ago for the tungsten insert in the anode’s center in the Filippov DPF geometry.
Conclusion
The analysis provided in the paper has demonstrated that these two neutron measurements methods – a number of activation techniques and a time-of flight methodology fulfilled with the nanosecond neutron pulses generated by a Dense Plasma Focus device – are able to characterize a big mainstream nuclear fusion chambers as neutron scatterers and absorbers shown the most important elements distorting their neutron fields.
First step of the methodology implementation that was used a set of activation techniques in the experiments described in [1] has confirmed its efficiency in the characterization of the nuclear fusion chambers from the point of view of the anisotropy of neutron field changes due to its absorption and scattering on the elements and systems of them.
Thus our another step in the sounding procedure for characterization of big fusion reactor chambers by means of a compact neutron source with a nanosecond pulse duration will consist of the spectral measurements of the nanosecond neutron emission produced by the PF-6 device itself and its distortions provided by the simulator of a big main-stream nuclear fusion device.
Acknowledgement
This work was supported by the International Atomic Energy Agency Project F1.30.18 in the frame of the CRP grant 22745, as well as by the International Atomic Energy Agency CRP grants RC-19248 and RC-19253, by the R.F. State Programme No. 007-00129-18-00 and by the grants of the Russian Foundation for Basic Researches, Project No. 16-08-00189.
References
- Gribkov VA, Bienkowska B, Paduch M. Examination of a chamber of a large fusion facility by means of neutron activation techique with nanosecond neutron pulse generated by dense plasma focus device PF-6. Fusion Engineering and Design. 2015; 125: 109–117. Ref.: https://goo.gl/LZwZwe
- Ref.: http://www.ccfe.ac.uk/jet.aspx
- Ref.: https://goo.gl/KPkj9k
- Ref.: https://goo.gl/8BLUfy
- Ref.: https://goo.gl/gTi68S
- Ref.: https://goo.gl/oyd3cm
- Stygar W, Austin K, Awe T, Bailey J, Breden E, et al. IEEE 21st International Conference on Pulsed Power (PPC). 2017; 18-22. Ref.: https://goo.gl/QSZ6jD
- Bernard A, Bruzzone H, Choi P, Chuaqui E, Gribkov V, et al. Scientific status of plasma focus research. Journal of the Moscow Phys Soc.1988; 8: 93-170. Ref.: https://goo.gl/pUc9qb
- Scholz M, Miklaszewski R, Gribkov VA, Mezzetti F. PF-1000 device. Nukleonika. 2000; 45: 155-158. Ref.: https://goo.gl/HtVSTQ
- Scholz M, Bienkowska B, Gribkov VA. Czechoslovak. J of Physics. 2002; 52 (Supplement D): D85-D92.
- Gribkov VA, Karpinski L, Strzyzewski P, Scholz M, Dubrovsky A. Czechoslovak. J Physics. 2004; 54 (Suppl. C): C191-C197.
- Gribkov VA, Dubrovsky AV, Scholz M, Jednorog S, Karpiński L, et al. PF-6 an effective plasma focus as a source of ionizing radiation and plasma streams for application in material technology, biology and medicine. Nucleonika. 2006; 51: 55-62. Ref.: https://goo.gl/e9oLfb
- Jednorog S, Szydlowski A, Bienkowska B, Prokopowicz R. Proc. of the 6th All Polish Conference on Radiochemistry and Nuclear Chemistry, Krakow (Poland). 2013; 21-24.
- Tilleyab DR, Chevesac CM, Godwinac JL, Haled GM, Hofmann HM, et al. Energy levels of light nuclei A=5, 6, 7. Nucl Phys. 2002; A 708 3-163. Ref.: https://goo.gl/MC3M98
- MCNP – A general Monte Carlo N – Particle Transport Code, Version 5, X-5 Monte Carlo Team LANL. 2003; Ref.: https://goo.gl/qT8X1n
- MCNP 5DATA: Standard Neutron Photoatomic, Photonuclear, and Electron Data Libraries for MCNP5 (CCC-710).
- Bienkowska B, Prokopowicz R, Scholz M, Kaczmarczyk J, Igielski A, et al. AIP Conference Proceedings. 1612, 105: 2014; Ref.: https://goo.gl/JTxjtc
- Gribkov VA, Banaszak A, Bienkowska B, Dubrovsky AV, Ivanova-Stanik I, et al. Plasma dynamics in the PF-1000 device under full-scale energy storage: II. Fast electron and ion characteristics versus neutron emission parameters and gun optimization perspectives. J Phys D App Phys. 2007; 40: 3592-3607. Ref.: https://goo.gl/WabVYq
- Curtiss LE. Introduction to Neutron Physics. Princeton, NJ: Van Nostrand. 1959.
- Vlasov NA. Neutrons (Neitrony). M: Nauka. 1971; 69-71.
- Ref.: http://www.acs-tm.pl

