Figure 4
Failure-oriented-accelerated-testing (FOAT) and its role in assuring electronics reliability: review
E Suhir*
Published: 06 January, 2023 | Volume 6 - Issue 1 | Pages: 001-018

Figure 4:
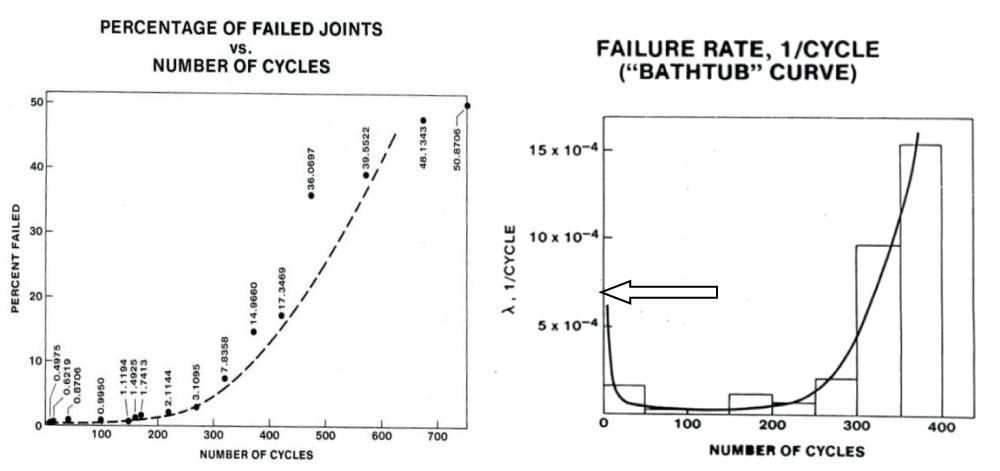
Figure 4: FOAT data (left): tests continued until half of the population failed; the wear-out portion of the experimental bathtub curve (right) is approximately of the same duration as its steady-state portion Experimental BTC for solder joint interconnections in a flip-chip Si-on-Si Bell Labs design. The arrow indicates the initial point of the IMP of the BTC, where the critical time derivative of the nonrandom SFR should be determined. It is the level of this derivative that helps to answer the basic “to BIT or not to BIT” question.
Read Full Article HTML DOI: 10.29328/journal.ijpra.1001048 Cite this Article Read Full Article PDF
More Images
Similar Articles
-
Failure-oriented-accelerated-testing (FOAT) and its role in assuring electronics reliability: reviewE Suhir*. Failure-oriented-accelerated-testing (FOAT) and its role in assuring electronics reliability: review. . 2023 doi: 10.29328/journal.ijpra.1001048; 6: 001-018
Recently Viewed
-
Sinonasal Myxoma Extending into the Orbit in a 4-Year Old: A Case PresentationJulian A Purrinos*, Ramzi Younis. Sinonasal Myxoma Extending into the Orbit in a 4-Year Old: A Case Presentation. Arch Case Rep. 2024: doi: 10.29328/journal.acr.1001099; 8: 075-077
-
High-Performance Liquid Chromatography (HPLC): A reviewAbdu Hussen Ali*. High-Performance Liquid Chromatography (HPLC): A review. Ann Adv Chem. 2022: doi: 10.29328/journal.aac.1001026; 6: 010-020
-
Drug Rehabilitation Centre-based Survey on Drug Dependence in District Shimla Himachal PradeshKanishka Saini,Palak Sharma,Bhawna Sharma*,Atul Kumar Dubey,Muskan Bhatnoo,Prajkta Thakur,Vanshika Chandel,Ritika Sinha. Drug Rehabilitation Centre-based Survey on Drug Dependence in District Shimla Himachal Pradesh. J Addict Ther Res. 2025: doi: 10.29328/journal.jatr.1001032; 9: 001-006
-
Poly-dopamine-Beta-Cyclodextrin Modified Glassy Carbon Electrode as a Sensor for the Voltammetric Detection of L-Tryptophan at Physiological pHMohammad Hasanzadeh*,Nasrin Shadjou,Sattar Sadeghi,Ahad Mokhtarzadeh,Ayub karimzadeh. Poly-dopamine-Beta-Cyclodextrin Modified Glassy Carbon Electrode as a Sensor for the Voltammetric Detection of L-Tryptophan at Physiological pH . J Forensic Sci Res. 2017: doi: 10.29328/journal.jfsr.1001001; 1: 001-009
-
WMW: A Secure, Web based Middleware for C4I Interoperable ApplicationsNida Zeeshan*. WMW: A Secure, Web based Middleware for C4I Interoperable Applications. J Forensic Sci Res. 2017: doi: 10.29328/journal.jfsr.1001002; 1: 010-017
Most Viewed
-
Evaluation of Biostimulants Based on Recovered Protein Hydrolysates from Animal By-products as Plant Growth EnhancersH Pérez-Aguilar*, M Lacruz-Asaro, F Arán-Ais. Evaluation of Biostimulants Based on Recovered Protein Hydrolysates from Animal By-products as Plant Growth Enhancers. J Plant Sci Phytopathol. 2023 doi: 10.29328/journal.jpsp.1001104; 7: 042-047
-
Sinonasal Myxoma Extending into the Orbit in a 4-Year Old: A Case PresentationJulian A Purrinos*, Ramzi Younis. Sinonasal Myxoma Extending into the Orbit in a 4-Year Old: A Case Presentation. Arch Case Rep. 2024 doi: 10.29328/journal.acr.1001099; 8: 075-077
-
Feasibility study of magnetic sensing for detecting single-neuron action potentialsDenis Tonini,Kai Wu,Renata Saha,Jian-Ping Wang*. Feasibility study of magnetic sensing for detecting single-neuron action potentials. Ann Biomed Sci Eng. 2022 doi: 10.29328/journal.abse.1001018; 6: 019-029
-
Pediatric Dysgerminoma: Unveiling a Rare Ovarian TumorFaten Limaiem*, Khalil Saffar, Ahmed Halouani. Pediatric Dysgerminoma: Unveiling a Rare Ovarian Tumor. Arch Case Rep. 2024 doi: 10.29328/journal.acr.1001087; 8: 010-013
-
Physical activity can change the physiological and psychological circumstances during COVID-19 pandemic: A narrative reviewKhashayar Maroufi*. Physical activity can change the physiological and psychological circumstances during COVID-19 pandemic: A narrative review. J Sports Med Ther. 2021 doi: 10.29328/journal.jsmt.1001051; 6: 001-007

HSPI: We're glad you're here. Please click "create a new Query" if you are a new visitor to our website and need further information from us.
If you are already a member of our network and need to keep track of any developments regarding a question you have already submitted, click "take me to my Query."


